
$49/ month
Full SOT Indicator Hub access, billed monthly.
- All main chart tools
- SOT Flow & Momentum Panel
- Future updates to included tools [CONFIRM]
- Fully customisable settings
SOT Indicator Hub for TradingView
A curated TradingView toolkit that brings market structure, levels, volume, divergence, flow & momentum together in one organised workspace.
Main chart tools & a dedicated Flow & Momentum Panel, in one organised toolkit.
From $49 per month, or 14 months for the price of 12.
Analytical tools for education & chart study. No signals or trade instructions.
Why Indicator Hub exists
There are thousands of indicators on TradingView. The hard part is knowing which information matters now, which readings simply repeat each other, and whether the evidence on your chart actually agrees. SOT Indicator Hub is built to make that process clearer.
For you if:
Not for you if:
Everything included
Use one tool or several. Switch on only what the market & timeframe in front of you call for.
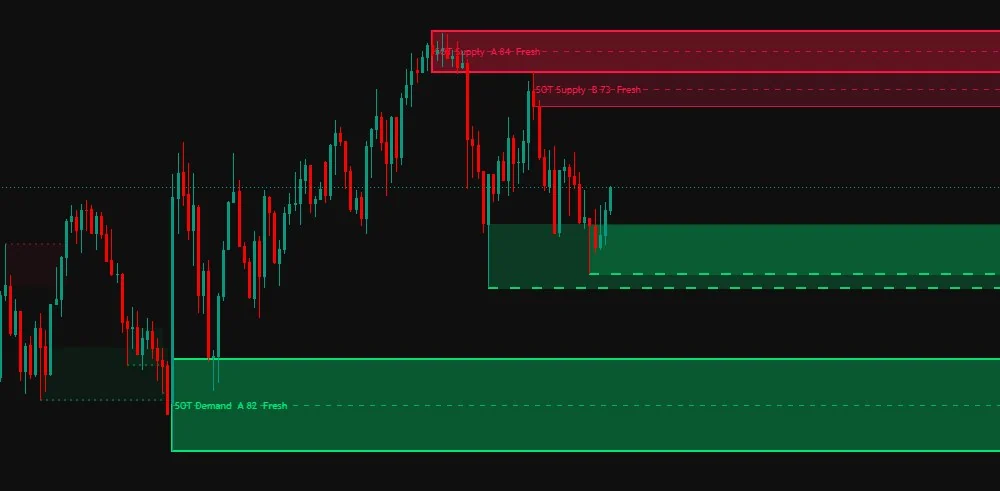
Keeps meaningful reaction areas visible, with each zone graded by quality.
See belowOrder blocks, breaks of structure & fair value gaps, kept visible as price develops.
See belowLevels drawn where several independent sources agree, each with a record of how price has treated it.
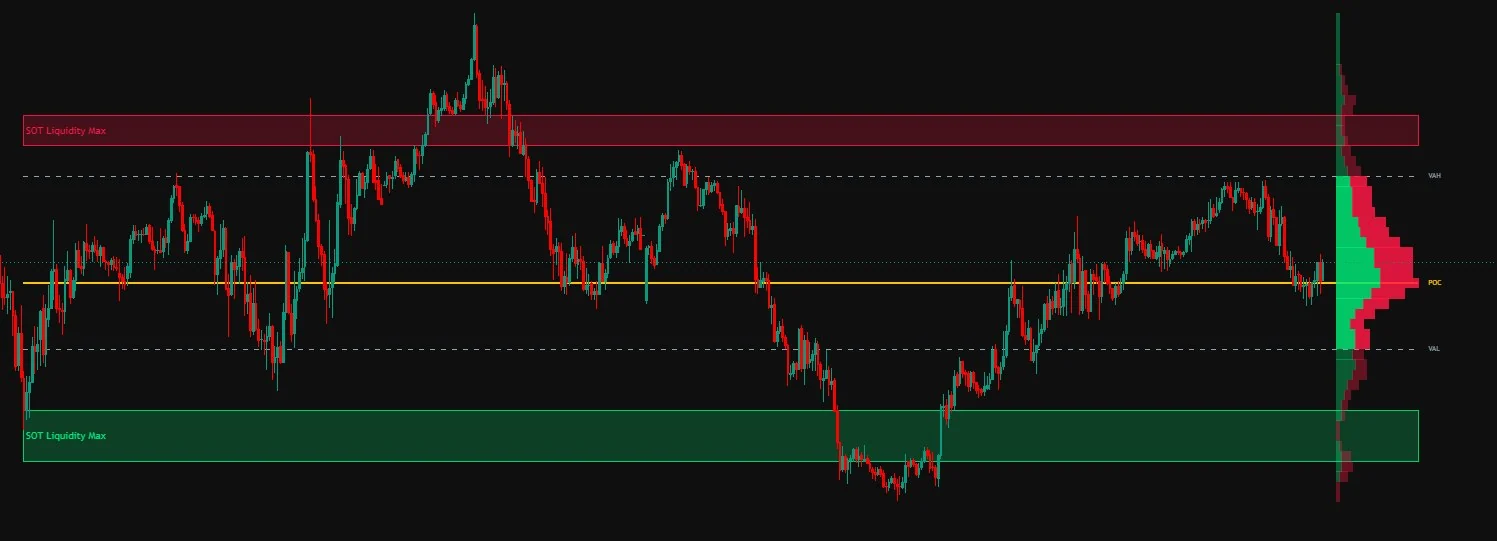
See belowShows where trading activity has concentrated across price, with low-volume Liquidity Max zones.
Session, weekly, monthly & swing-anchored VWAP with bands.
See belowTrend context at a glance, with the line colour following the slope.
See belowReads each bar's volume & range against the market's own behaviour.
See belowScores how stretched a move to the downside has become.
See belowScores how stretched a move to the upside has become.
See belowShows when price & multiple internal measures begin to disagree.
See belowDirectional volume pressure within the move, and how it builds or fades over time.
See belowClassic momentum context, inside the same panel.
Faster momentum readings for shorter-term context.
Trend & momentum shifts in one familiar reading.
Momentum weighted by volume.
Supply & Demand
Supply & Demand keeps meaningful reaction areas visible as the market develops, so you can see where price previously moved away with intent and how it behaves when it returns.
More on the main chart
Every main chart tool has its own on/off switch and settings, so you can build a chart around the question you are asking.
Capitulation & Euphoria Zones
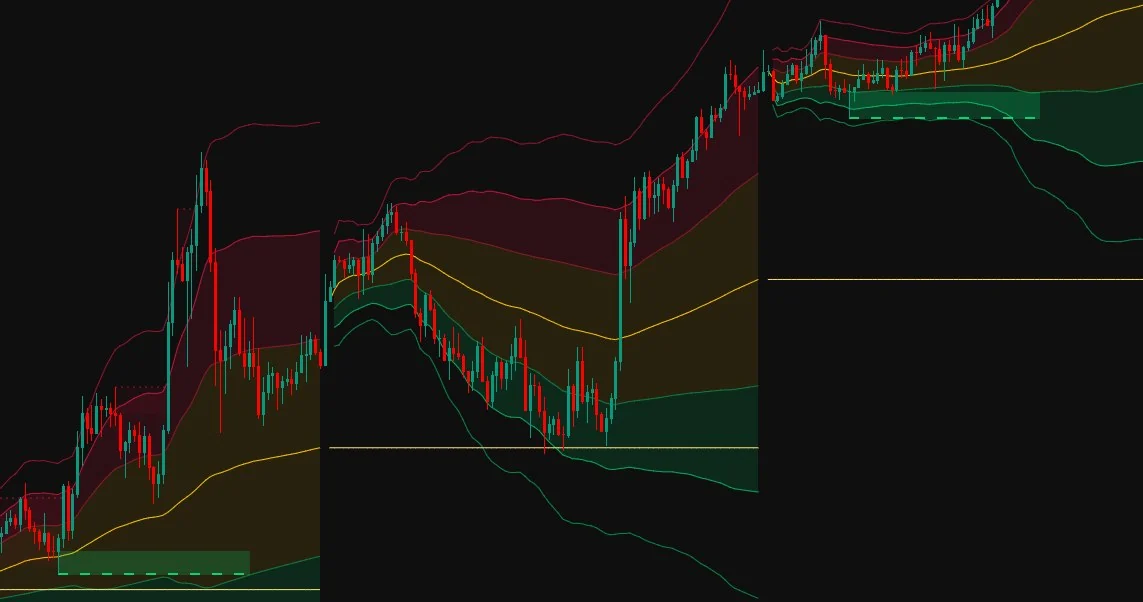
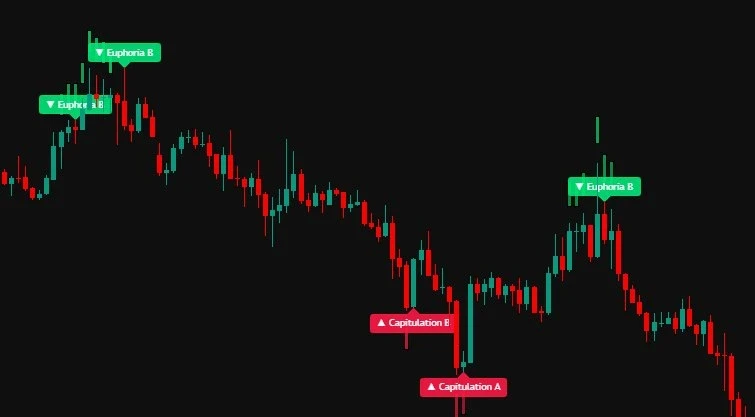
Capitulation Zone and Euphoria Zone score how far a move has stretched, from 0 to 100. The score combines depth from the recent extreme, distance from the mean, short-term momentum exhaustion and unusual volume, each ranked against the market's own recent behaviour, so the zones adapt to every instrument & timeframe.
When a stretched move is followed by a candle closing the other way, a label marks the bar with a grade. A means three or four of the four confirmations were present, B two, C one. The confirmations are a sweep of the prior extreme that closes back inside, a close back inside the outer Bollinger Band, a fast RSI flip from an extreme, and a high-volume rejection wick.
A stretched move can stretch further. The zone score and grade describe how extended price is and how many confirmations are present, not where price will go next.
Multi-Indicator Divergence
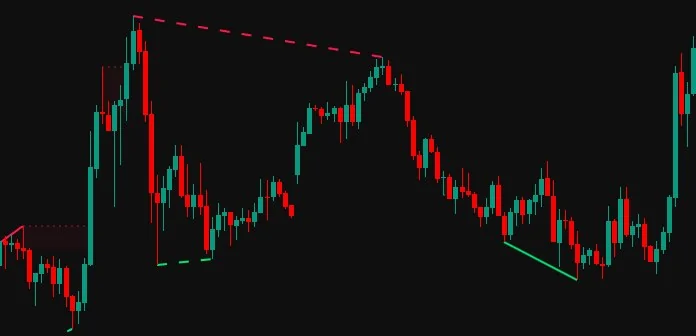
Instead of relying on a single oscillator, Multi-Indicator Divergence checks for agreement across up to eight momentum & volume-derived measures at the same price swing.
Confluence Score
Shows how many of your selected inputs show the same divergence at the same swing, giving you more context than one oscillator alone.
The Confluence Score reflects indicator agreement. It is not a probability of profit or a trading signal.
SOT Flow & Momentum Panel
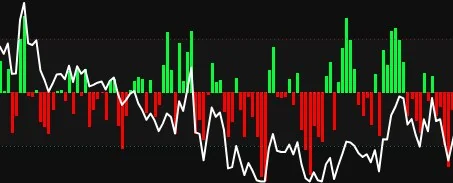
Compare what price is doing with the directional volume pressure underneath it. Use the panel to ask one question: does the internal evidence support what I am seeing above?
SOT Delta Pressure & Cumulative Volume Delta are built by Smart Online Trader. Where the data allows, they read lower-timeframe candles to separate buying from selling volume.
 Delta PressureCumulative Volume Delta
From $49 per month. Every tool included.
You can build a chart from free scripts. Indicator Hub is for traders who would rather start with the toolkit already organised.
How it works
Pick monthly access or 14 months for the price of 12.
[CONFIRM: how and when the member provides their TradingView username]
[CONFIRM: how access appears in TradingView and how long activation takes]
Pricing
The main chart tools & the SOT Flow & Momentum Panel are included in both plans.
$49/ month
Full SOT Indicator Hub access, billed monthly.
$588for 14 months
Pay for 12 months upfront and receive 2 additional months at no extra cost.
Equivalent to $42 per month across 14 months.
Prices in USD. South African clients' payments are processed in ZAR at the prevailing exchange rate. [CONFIRM: cancellation & renewal terms]
FAQ
Everything you need to know before you get access.
SOT Indicator Hub
Main chart tools & a dedicated Flow & Momentum Panel, organised in one TradingView toolkit.